By Jan Hloušek and Martin Pavlíček
In the course of the development of Space Engineers, a lot of optimizations were made to leverage the modern CPUs with multicore architectures. The parallelization of systems for such a complex game is a very difficult task where the final impact on the overall performance is sometimes unclear, as lots of systems, tasks, and threads influence it in non-deterministic ways.
Motivation
We set out to analyze various optimization techniques in a more controlled and simpler environment for the sake of better understanding the parallelization paradigms and to be leveraged in further Space Engineers development. As an environment, we chose Manual Badger (source code) written by Marek Rosa, which was simple enough to quickly iterate and see the results. As we started, Manual Badger was already written using data oriented design and naively parallelized. Our goal was to improve performance to better leverage multi-core CPUs, namely by reduction of sync points (Chapter 1), improvement of cache coherency (Chapter 2) and ultimately using massive parallelism via GPGPU (Chapter 3).
Some of the steps will change the outcome of the simulation slightly, which we have not addressed properly for the sake of simplicity.
In this first chapter, which you are now reading, the focus is on low-hanging fruit, sync points, a few micro-optimizations, and comparison of codegens.
Source Code
The source code with experiments from this chapter: here.
Measurements
| Step | Iteration [ms] | Thread yield [multiplier, CPU %] | ||
| AMD | Intel | AMD | Intel | |
| 1. Original | 5 | 3.53 | 3.93x, 55% | 3.63x, 87% |
| 2. Overhead | 3.07 | 2.30 | 5.37x, 81% | 4.84x, 100% |
| 3. Micro-optimizations | 1.68 | 0.95 | 4x, 84% | 4.80x, 100% |
| 4. Sync points | 0.98 | 0.682 | 6.8x, 95% | 6.65x, 100% |
| 5. Parallel lib | 0.91 | 0.679 | 7.36x, 100% | 6.51x, 100% |
| 6. Codegen | 0.92 | 0.45 | 8.13x, 100% | 6.36x, 100% |
Iteration [ms] – time to finish single iteration of the algorithm
Thread yield – the multiplier is a single-threaded run of an algorithm with current changes vs a multithreaded run, giving us a multiplier of parallelization improvement; CPU # is the utilization of the CPU in the task manager.
Measured values were calculated as an average from multiple (thousands) iterations of the algorithm, all values are in this table.
Hardware
AMD – Ryzen 7 1700 8-core (16 threads)
Intel – i7-9700K 8-core (8 threads)
Steps taken
1. Original
Code was instrumented with simple Stopwatch measurements (x86 TSC register readings) and added the ability to easily switch between single-threaded and multithreaded variants of the algorithm.
2. Overhead (#define NO_OVERHEAD)
Added ability to skip any excessive code like render, data collection etc. which was allocating a lot of managed memory and running in a single thread, thus affecting overall measurements. This code was skipped in all successive steps.
3. Micro-optimizations (#define OPTIMIZED)
During our initial algorithm and bottleneck analysis, we identified a few easy-to-optimize spots that improved the overall performance of the algorithm greatly. Namely, it is optimized access to managed arrays at hotspot code-paths which avoids redundant array range checks, identified common cases in the Mating function, and introduced a fast code-path. Finally, we optimized frequent access to the [ThreadStatic] field in RandomGen class where frequent access to TSL storage turned out to be a performance issue.
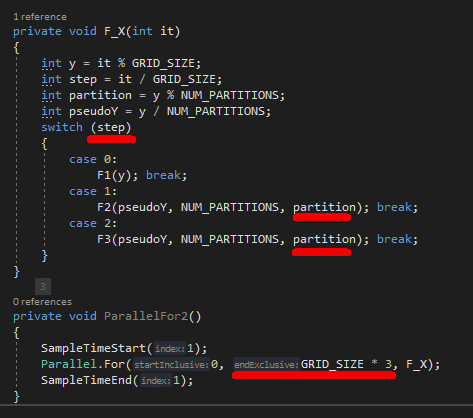
4. Sync points (#define PARALLEL_2)
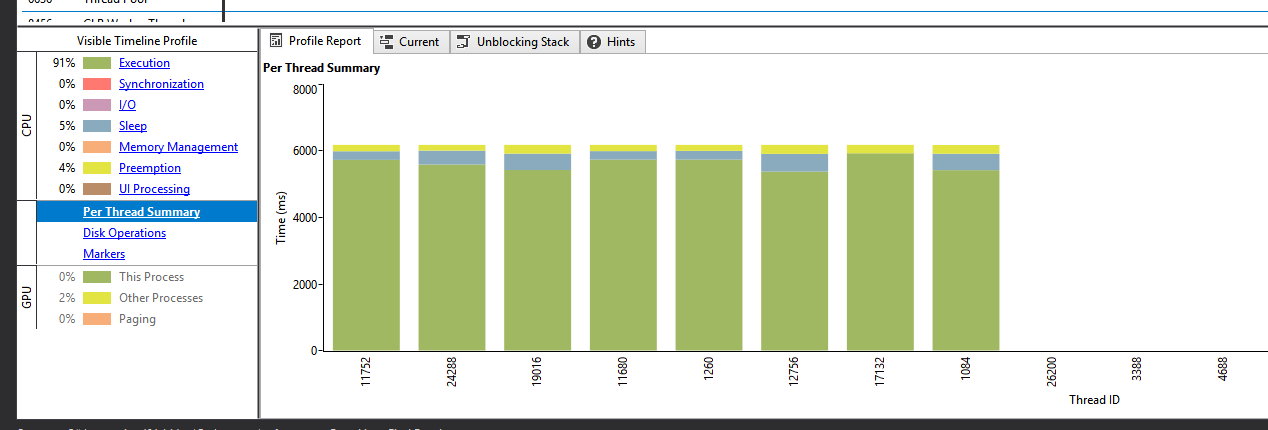
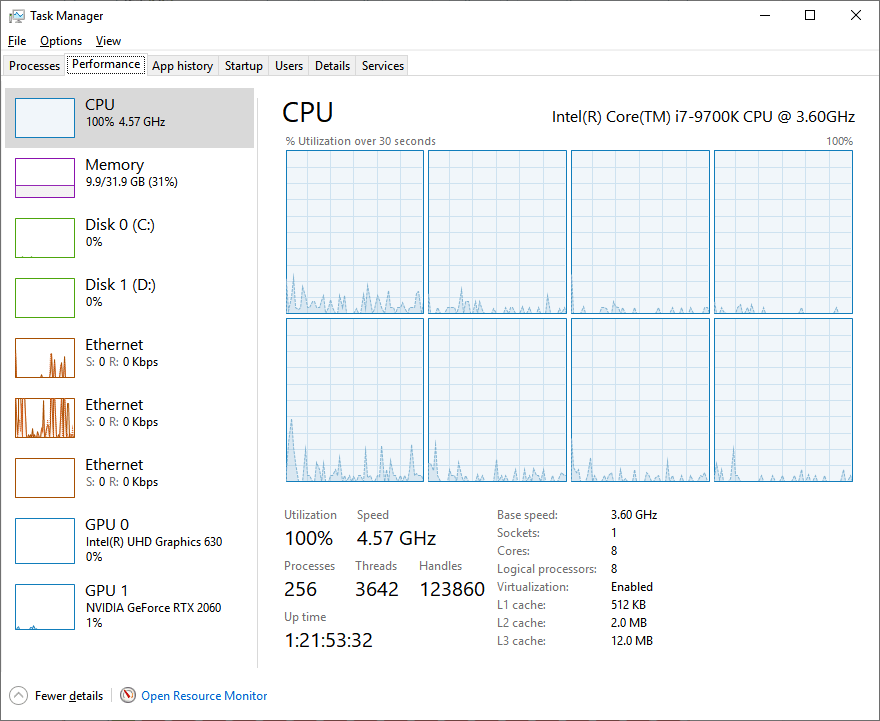
Using Concurrency Visualizer, we identified that the threads are mostly sleeping or burning time in synchronization (notice the more saturated blue sections in the Task Manager screen in designating a percentage of time given core spent in kernel code).
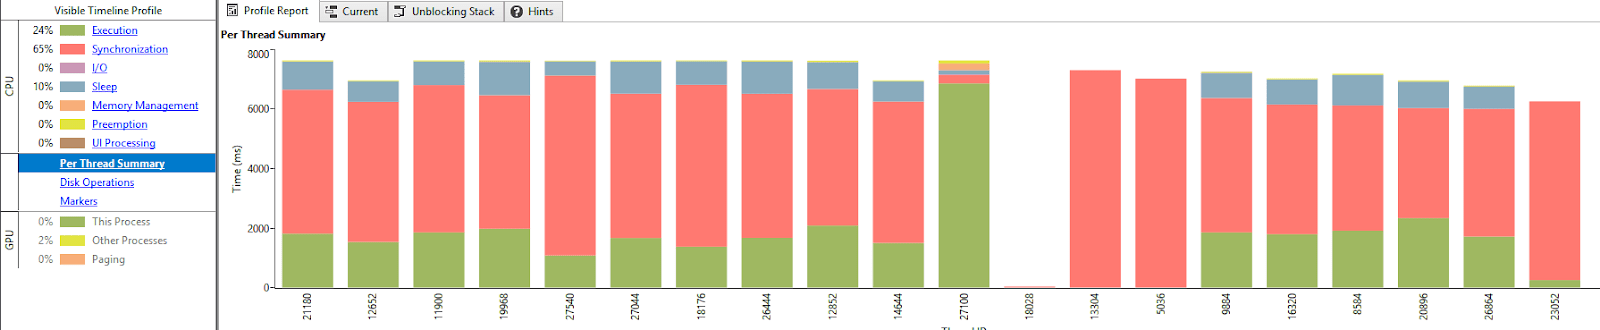
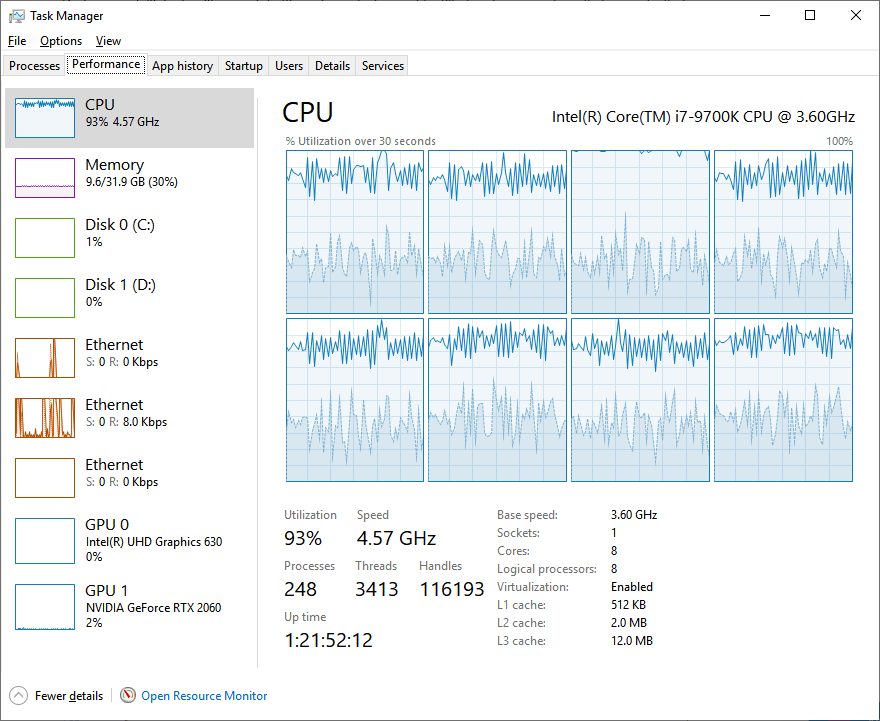
This was caused by the number of synchronization points in the original solution. By removing most of the synchronization points in each iteration, thread yield got much better. Notice increase in overall thread utilization and radical decrease in thread kernel times.
Explanation of synchronization points removal:
- Each Parallel.For takes some time to wake up all threads at the beginning
- Each Parallel.For has to wait at the end for the slowest thread to finish its work
- Each algorithm step was iterating 256 lines of grid, where in Step 2 and 3 it was run individually for each partition. Thus there were 11 Parallel.For executions in one algorithm iteration:
- Step1
- Step2, partition 0
- Step2, partition 1
- Step2, partition 2
- Step2, partition 3
- Step2, partition 4
- Step3, partition 0
- Step3, partition 1
- Step3, partition 2
- Step3, partition 3
- Step3, partition 4
We introduced one Parallel.For, which runs in a wider range, executing all the steps and partitions consecutively:
Note: This code is just proof of concept, to show the performance impact of removing the sync points. In reality, it would need to be implemented more defensively, to make sure the work is really executed consecutively (i.e. some thread which will fall to sleep during Step1 can get awakened while the rest of the threads are already processing Step2 -> access to the same memory). The overall performance impact should be similar though. We haven’t gone the whole way for the sake of time.
4. Parallel lib (#define PARALLEL_LIB)
Selected a different parallel library, where we can easily affect the threading model. Setup the number of threads accordingly to the system it runs on. The number of parallel threads = the number of available hardware threads minus 1 as the main thread is also performing the work. On AMD test hardware it runs with 16 threads (including main thread), on Intel it runs with 8 threads.
5. Codegen (#define CPP)
.NET JIT is notoriously known for its, said lightly, sub-optimal codgen. For this reason, we’ve rewritten the Manual Badger to the C++ (codename Native Porcupine) to test how much performance we could gain using the more optimal codegen that C++ compilers (namely LLVM and MSVC++) provide. Interestingly enough, while Intel platform profited greatly from this change, we’ve seen up to 50% performance improvement, we did not observe any improvement on AMD system. We’ll need to conduct further investigation to find out what is the cause for this anomaly.
Conclusion
Overall, we got 5.4x and 7.8x performance improvement on AMD and Intel platforms respectively. We’ve also improved the multithreaded scaling of the algorithm to 8.13 (3.93 previously) and 6.36 (3.63 previously) respectively.
Important takeaways are:
- Do not slow down parallel processing by sync points
- Do not mix single-threaded and multithreaded code
- Micro optimizing is still a viable option, as it impacts all threads processing
- Since test data fit into the CPU cache in its entirety the test case is purely computation-bound. Increasing GRID_SIZE parameter beyond CPU cache size is likely to exhibit different bottlenecks and performance issues where a different set of optimizations would need to be applied to get comparable results
- C++ code gen is faster by 50% in comparison to C# in this case
There were many other tests/benchmarks run (checking CPI, bus bandwidth, and branch prediction). They did not show any big wins.
Next steps and question marks:
- Investigate AMD C++ performance, as it performs unexpectedly badly (same perf as C#)
- Investigate parallel scaling, ideal multiplier going from single to multithreaded should be 16x on AMD and 8x on Intel, there is still room for improvement
- More cache-friendly access, test on larger data
- Test performance using GPU (CUDA and OpenCL)