By Jan Hloušek and Martin Pavlíček
Motivation
We set out to analyze various optimization techniques in a more controlled and simpler environment for the sake of better understanding the parallelization paradigms and to be leveraged in the further Space Engineers development. As an environment, we chose Manual Badger (original source code) written by Marek Rosa, which was simple enough to quickly iterate and see the results. As we started, Manual Badger was already written using data oriented design and naively parallelized. Our goal was to improve performance to better leverage multi core CPUs, namely by reduction of sync points (Chapter 1), improvement of cache coherency (Chapter 2) and ultimately using massive parallelism via GPGPU (Chapter 3).
Some of the steps will change the outcome of the simulation slightly, which we have not addressed properly for the sake of simplicity.
In the previous chapter we focused mainly on the overall performance of the Manual Badger algorithm and parallelization basics. Today we’ll focus on code patterns that can make or break the performance of your system and/or its scaling on multi-core CPUs and present solutions for the cases where performance suffers greatly.
In order to measure performance on other platforms than PC and to remove any unwanted performance interference caused by the WinForms and scaffolding code around, we extracted the Badger algorithm into a standalone console app and changed the benchmarking technique to a sequential 5K updates per measurement to minimize measurement errors.
Source Code
The source code with experiments from this chapter: here.
Overview
All data available here: Platform Runoffs
| PC i7-9700K | XBox One X | Ryzen 3700X | ||||
| 1 Thread | 4 Threads | 8 Threads | 4 Threads | 1 Thread | 8 Threads | |
| Chapter 1 | 22,116 ms | 6,177 ms (90%) | 3,394 ms (81%) | – | 23,122 ms | 5,041ms (41%) |
| Standalone app | 17,725 ms | 4,671 ms (95%) | 2520 ms (88%) | 17,758 ms | 17,576 ms | 3,904 ms (56%) |
| Transparent code | 6,741 ms | 5,614 ms (30%) | 4946 ms (17%) | 26,169 ms | 7,224 ms | 5,975 ms (15%) |
| Uncontested memory | 6,989 ms | 2,185 ms (80%) | 1640 ms (53%) | 10,254 ms | 6,467 ms | 2,063 ms (39%) |
| Thread affinity | 6,989 ms | 2,118 ms (83%) | 1640 ms (53%) | 8,813 ms | 6,467 ms | 1,315 ms (61%) |
| Hot cache | 6,989 ms | 1,992 ms (88%) | 1504 ms (58%) | 8,226 ms | 6,467 ms | 1,234 ms (65%) |
| Uncontested data set | 6,989 ms | 1791 ms (97%) | 980 ms (89%) | – | 6,467 ms | 1,169 ms (69%) |
| Alternative affinity | – | – | – | – | 6,467 ms | 839 ms (96%) |
Table 1: Time for 5K iterations of the Badger algorithm. Value in parenthesis indicates algorithm scaling relative to single-threaded performance
Opaque code blocks
All phases of the Badger algorithm are nicely data-oriented and code flow is very linear, with no objects, no abstractions, and almost no virtual jumps. Compilers love this because they can optimize such code very well, inline and fuse operations, get rid of redundant memory accesses, and in some cases even vectorize the computation. The simpler the code, the better CPUs reason about it and Instruction-Level-Parallelize it to deliver the best performance possible.
The word almost in the previous paragraph is very important though. The random number generator used in all the algorithm phases exhibits at least 2 indirect jumps; to TLS and to Random class.
[ThreadStatic]
static Random m_random;
int GetRandomInt(int  minValue, int maxValue)
{
    return m_random.Next(minValue, maxValue);
}
The average wallclock time for 5K iterations of the Badger algorithm with this opaque code block is 17725ms. Let’s replace the Random class with equivalent inline implementation to get rid of the first indirection.
[ThreadStatic]
static int m_state;
double Sample()
{
   var randomBits = (1103515245 * m_state + 12345) & int.MaxValue;
   m_state = randomBits;
   return ((double)randomBits) * 4.6566128752458E-10;
}
int GetRandomInt(int minValue, int maxValue)
{
   return (int)(Sample() * (double)(maxValue - minValue)) + minValue;
}
Average time improves all the way to 9200ms. Very nice indeed. We can go even further and remove the second indirection/system call by removing the [ThreadStatic] attribute. This makes the random generator absolutely transparent to the compiler and the final runtime becomes 6741ms. That means that almost ⅔ of the runtime was burned outside of the core algorithm in utility code.
When optimizing for peak performance the devil is in the details and satellite utility code more or less unrelated to the core algorithm can absolutely wreck your performance if you don’t profile it properly.
Contested memory
With a well-performing single-threaded code in place, we can move our focus on parallelization and scaling. Given the relaxed parallelization model from the previous chapter, we can run the algorithm on 4 threads and measure an average runtime of 5614ms …. what? With 4x more horsepower we get a mere 1.2x improvement (achieved scaling 30%). That can’t be right. To make matters even more confusing, going one step back and adding the [ThreadStatic] on top of the m_state yields not only a better runtime of 2536ms, compared to a single-threaded run it also scales fantastically at 90.67%.
The explanation for this lays all the way down in memory operation transitivity guarantee of the x86 memory model; in other words in hardware. You can ask Google for details, in short, the implementation implication of this guarantee is that whenever core writes a value, the target cache line needs to be flushed on all cores.
Armed with this knowledge, one can easily infer what’s going on; while the [ThreadStatic] (e.g. TLS) ensures that m_states are dispersed across different cache lines for each thread, when threads start contesting single m_state the cache line eviction gets into play big time.
To be absolutely clear, this is not specific to static variables.
You can observe this phenomenon on any memory. Consider the following code snippet:
void CacheLineContest(int[] memoryBlock, int index)
{
    for(int i = 0; i & ITERATIONS; i++)
    {
        Interlocked.Increment(ref memoryBlock[index]);
    }
}
Running this code in parallel on 4 threads with indices {0, 0, 0, 0} for 1M iterations will result in an average runtime of 63ms while an identical experiment with indices {0, 16, 32, 48} results in 4ms runtime. A whopping 15x improvement just by ensuring that cache lines are not contested. Given that a typical cache line is 64Bytes, I’ll leave it as an exercise for the reader why I chose stride of 16 for this test and why indices {0, 1, 2, 3} yield the same runtime (within a margin of error) as the {0, 0, 0, 0}.
Now when we understand what’s going on, we can easily address the scaling issue of our RNG.
IntPtr AllocState()
{
   //Assumes that each malloc call returns somewhat random
   //memory block sufficiently far away from other allocations
   return malloc(sizeof(int));
}

double Sample(IntPtr statePtr)
{
    var state = *(int*)statePtr;
    var randomBits = (1103515245 * state + 12345) & int.MaxValue;
    *(int*)statePtr = randomBits;

    return ((double)randomBits) * 4.6566128752458E-10;
}

int GetRandomInt(int minValue, int maxValue, IntPtr state)
{
    return (int)(Sample(state) * (double)(maxValue - minValue)) + minValue;
}
In this example, each thread calls AllocState immediately after it starts to secure itself an uncontested RNG state and then passes it to RNG methods at every use. Final measurements show a runtime of 6989ms for a single thread and 2185ms for 4 threads (scaling 80%) so we’ve achieved very admirable scaling while maintaining optimal ST performance of our algorithm.
When writing parallel algorithms you need to keep in mind not only explicit sync points like locks and barriers but also implicit memory synchronization and contestation when accessing shared mutable cache and/or writing intermediate results to shared memory to achieve good scaling.
Thread affinity
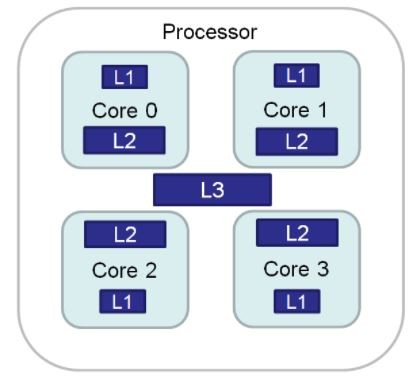
From the previous chapter, it should be pretty apparent that the CPU cache is very important for algorithm performance. What may not be that apparent at first is that the cache is not one homogeneous unit but rather a cascade of per-core levels with decreasing latency.
Given that threads are free to float between the cores (unless you say otherwise), every time the thread gets rescheduled by OS to a different core there is an explicit performance penalty of moving the thread resources (mainly registers) as well as implicit performance penalty incurred by necessity to re-populate the caches on the newly assigned core.
This penalty may vary wildly across HW simply because not all CPUs are created equal. For a case study, we can take a look at Intel i7-9700K (homogenous 8 core die) vs Xbox One X Jaguar die (2x4core module) and compare the performance impact of free-floating threads vs fixing the threads to their cores.
Starting with Xbox, we get 10254ms and 8813ms runtimes for the free-floating and fixed threads respectively. That’s a 16% improvement just by avoiding pathological “flaw” in the architecture of this CPU without changing a single line in the actual algorithm. What’s even more interesting is that the standard deviation of the runtime drops from 1785.44ms to 27.53ms when we fix/pin the threads which confirms the significant peaks caused by the thread “drifts”. Next, we have the Intel. As expected the difference is much smaller, 2185ms vs 2118ms, which confirms that the thread “drift” is much cheaper on dies with homogenous core layout.
The key takeaway point is that you should always measure your code on a diverse set of target hardware to make sure that you’re not accidentally hitting pitfalls of different manufactures and/or hardware generations.
Keep the cache hot
Currently, parallel threads process the working dataset in a quite orderly data-oriented manner, each thread processes one full line at a time. During phases, F2 and F3 though, threads are accessing Cells that are up to 2 lines away from the currently processed Cell. To make sure that the line currently updated by one thread is not read by a different thread at the same time we’ve introduced 5 line striding/partitioning.
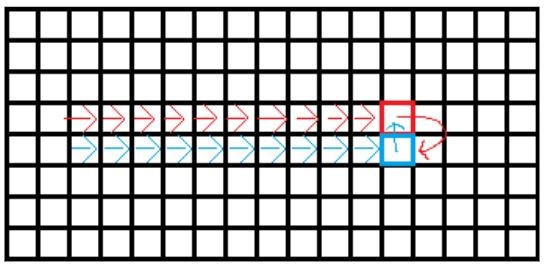
Unfortunately, this introduces two undesirable side effects. First, threads jump lines in an unpredictable manner, making it hard for the memory prefetcher to do its work effectively. It can still prefetch in-line cells, but the first cell of (almost) random next line is likely to hit cache miss. Second, peer cells from adjacent lines that we fetched to compute the current line won’t be used while processing some next line and a different set of peer cells will need to be fetched instead, causing additional cache misses. Surely we can do better.
If we put consecutive lines into batches of 4 or 8 that will be processed by a single thread at once, then the memory access pattern becomes much more coherent and fetched cells will be re-used while processing successive lines. Measured runtimes, 2118ms for original “random” stepping, 1992ms for 4-line batches, and 2095ms for 8-line batch with standard deviations 36ms, 182ms, and 304ms respectively.
Average runtime improvement is mediocre at best while increasing deviations between the runs indicate that we’re suffering from worsening tail effect. This is confirmed by the 8-line batch (which should have in theory even better cache utilization) having worse performance than the 4-line batch. The best I can come up with at this point is that when you already have a good data-oriented algorithm in place, further cache-oriented tweaking is likely to exhibit diminishing returns and if you’re not careful you can end up even with de-optimized code.
The road to hell is paved with good intentions and even the greatest optimization ideas can actually deoptimize your system in the final measurement, so always measure before and after your optimizations.
Contested data set
The last thing that remains at this point is to fix the poor 8T scaling. A quick look into the VTune profiler suggests that we’re heavily bound on memory access, specifically on caches, and fail to retire (read successfully execute instruction) up to 40% of available pipeline slots. This roughly translates to 40% of CPU not being used, which very well correlates to our measured scaling of 58% (100 – 42 = 58).
Seeing this on data-oriented algorithms that fit entire datasets into the cache is really weird … or is it thoough? A few paragraphs above we’ve discussed the “contested memory” pattern and how it affects multithreaded scaling on HW level. Could it be that as threads randomly process data lines in a random manner they effectively trash cache lines to each other and prevent effective utilization of cache hierarchies, the more threads there are the more pronounced this effect becomes?
In order to prove this theory, we’ll change the threading model once again and assign each thread its own set of consecutive lines, segment, and perform 5K iterations in parallel on each segment without any synchronization between the segments, then measure the time it takes all threads to process all iterations on their segments. Yes, at this point we’re bending the rules a bit as the simulation won’t be sound at segment boundaries, but we dare to claim that it’s good enough for the sake of testing and learning. Nonetheless, the final runtime is 1791ms for 4T and 980ms for 8T with a very admirable scaling of 89%.
Throwing more threads on a problem is not always going to make your program run faster.
Alternative Affinity
It is quite common for modern CPUs, especially with the recent rise of the Ryzen family CPUs, to sport up to 2 concurrent threads on a single physical core (hyper-threading) even on low-end CPU models. On our Ryzen 3700X we’ve pinned 2 threads on each core in the Thread affinity section to leverage hyper-thread-shared L1 cache on each core, thus minimizing cross-core data exchange and latencies associated with that. This was essential optimization for the case where the algorithm was bound by cross-core communication.
In the previous section, we’ve changed that and extensive cross-thread/core communication is no longer necessary. Now when we are no longer memory bound and much more compute-bound instead, it means that we can relax this constraint and pin the threads in a different manner so that only 1 thread occupies each physical core, effectively avoiding the hyper threads and core’s resource sharing. This should give each thread uncontested access to the core’s ALU and avoid thread-stalls that could occur when a core was occupied by a concurrent hyper thread. After this change runtime improves to 839ms (from 1169ms) with unbelievable scaling of 96%.
Conclusion
This chapter discussed a number of code patterns and their significance from both the software and hardware perspectives and outlined techniques that are effective at combating various performance bottlenecks they often impose.
Naturally, it is not possible to stop coding after every line to meditate over its performance, but you should always keep performance in mind the same way as you do with good coding standards and use profilers to identify problematic cases whenever you identify that your system doesn’t perform as well as desirable.
This series should then give you enough insight to fully understand the profiler’s findings and address them swiftly and with maximal efficiency.
In the future, we should take a look at the performance of various .NET runtimes/codegens and investigate possibilities of GPGPU computing as well.